

The short answer: inflation in the UAE has been moderate over the last ten years, averaging about 1.5% a year between 2015 and 2025 according to the World Bank. But even that small number compounds: a basket of goods that cost AED 10,000 in 2014 cost about AED 11,777 in 2025. The same amount left in a current account with no return buys about 85% of what it used to.
A worked example: AED 10,000 left idle for ten years
Suppose AED 10,000 went into a current account at the end of 2014 and was never touched. In 2025 the balance is still exactly AED 10,000. What changed? Prices.
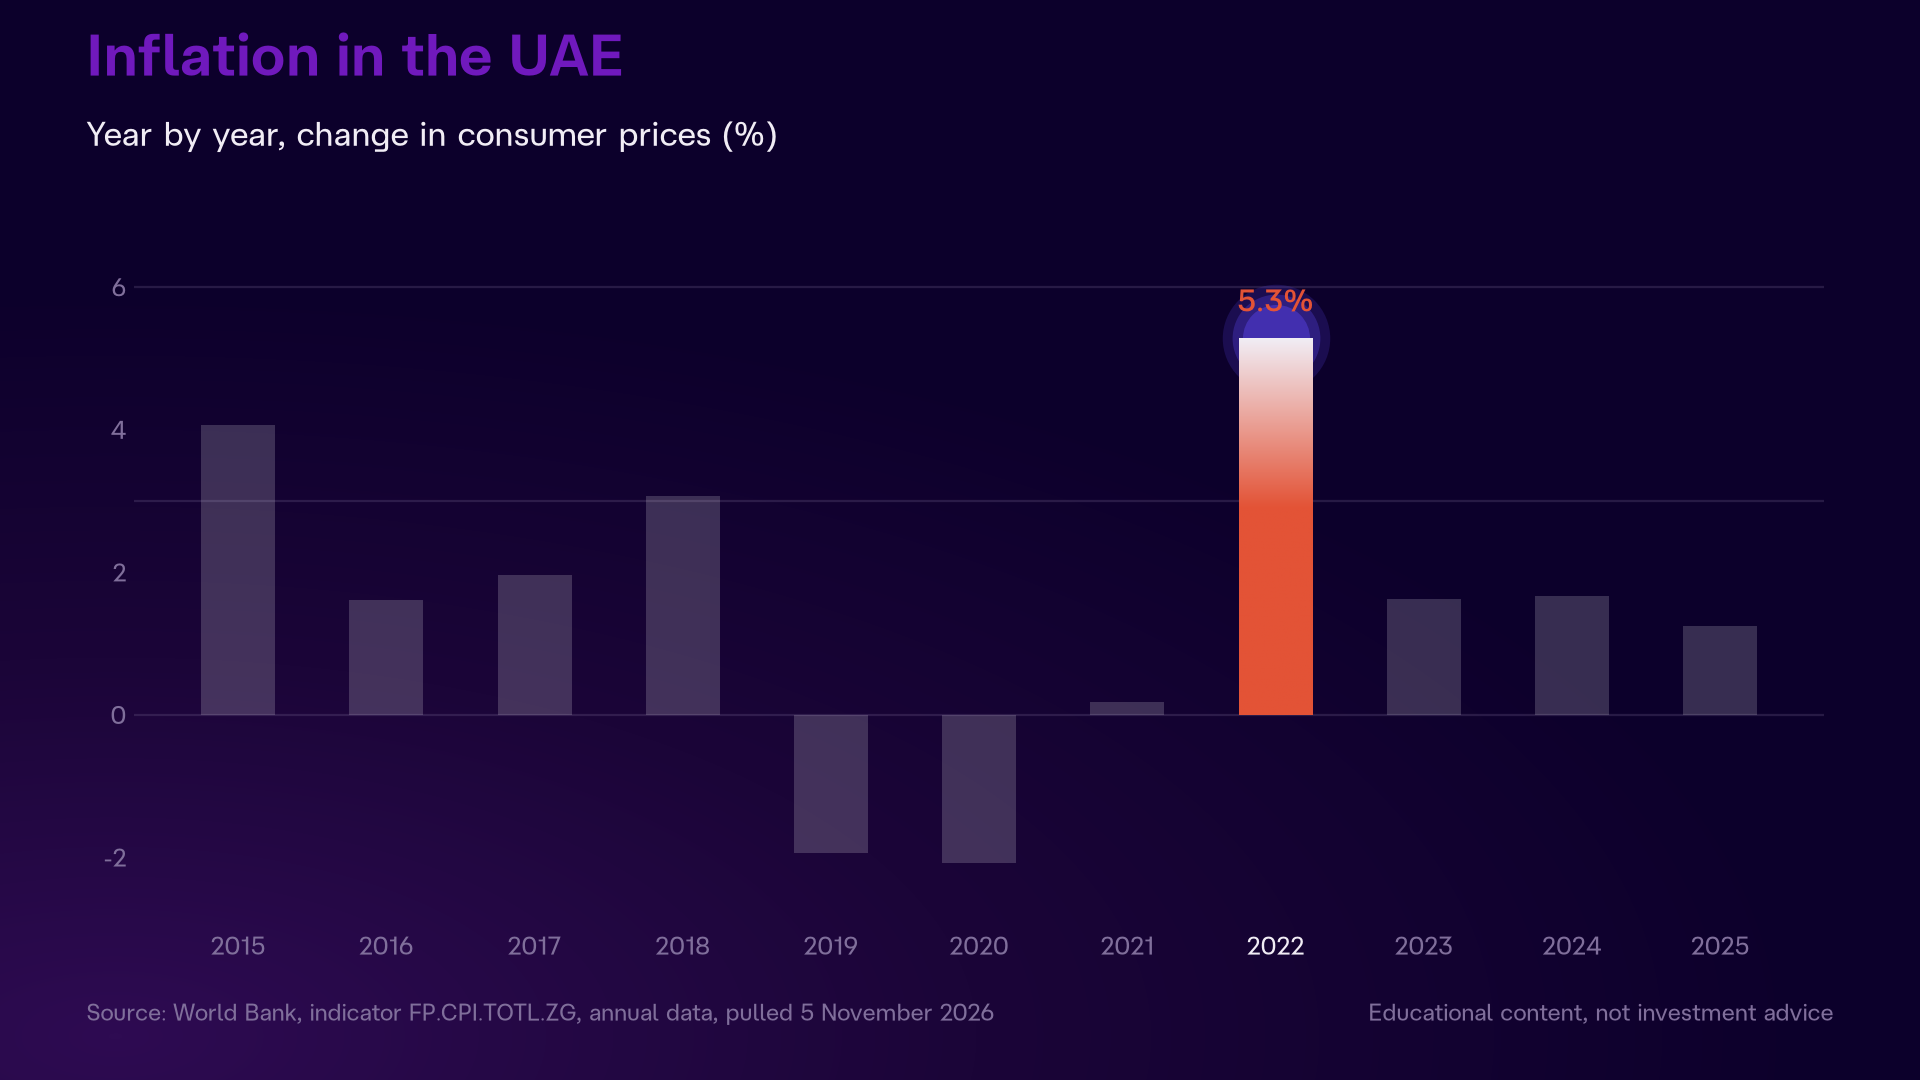
Take the official inflation rate for each year from 2015 to 2025 (World Bank, consumer price index) and apply it year after year to a basket that cost AED 10,000:
- After 2015 (inflation 4.1%): the basket costs AED 10,407.
- After 2018 (3.1%): AED 11,114.
- After 2019 and 2020 (prices fell 1.9%, then 2.1%): the basket went back down to AED 10,673.
- After 2022 (5.3%, the highest year of the period): AED 11,258.
- After 2025 (1.25%): AED 11,777.
The result: prices rose 17.8% over the whole period. The idle balance needs an extra AED 1,777 to buy the same basket. Put another way, AED 10,000 in 2025 buys what AED 8,491 bought in 2014. The gap, about 15% of purchasing power, never appears on a bank statement, because the number on the statement never moved.
On a closer scale: someone spending AED 10,000 a month on the same basket needs, at the 2025 inflation rate of 1.25%, about AED 125 more a month after a single year to buy the same things. A small number in one month, but it repeats every month, and the following year builds on it.
What inflation actually means
Inflation is the rate at which the prices of a basket of goods and services that households consume rise: housing, food, transport, education, health and the rest. In the UAE the Federal Competitiveness and Statistics Centre measures it through the consumer price index, and the World Bank publishes each country's annual rate in one comparable series.
The annual figure is an average across the whole basket. The price of any single item may rise more or less. That is why personal experience differs: someone paying rent and school fees sees prices differently from someone who pays neither. How a salary is split between needs, wants and saving is covered in our post on the 50/30/20 rule in dirhams.
Three facts from the chart:
- The highest year of the period was 2022 at 5.3%.
- Two years recorded falling prices: 2019 at 1.9% and 2020 at 2.1%. In those two years the basket got cheaper, and an idle balance bought more.
- In 2025 inflation was 1.25% according to the World Bank, and the Central Bank of the UAE's Quarterly Economic Review (June 2026) gives the same figure rounded, 1.3%, citing the Federal Competitiveness and Statistics Centre.
The UAE compared with the Gulf
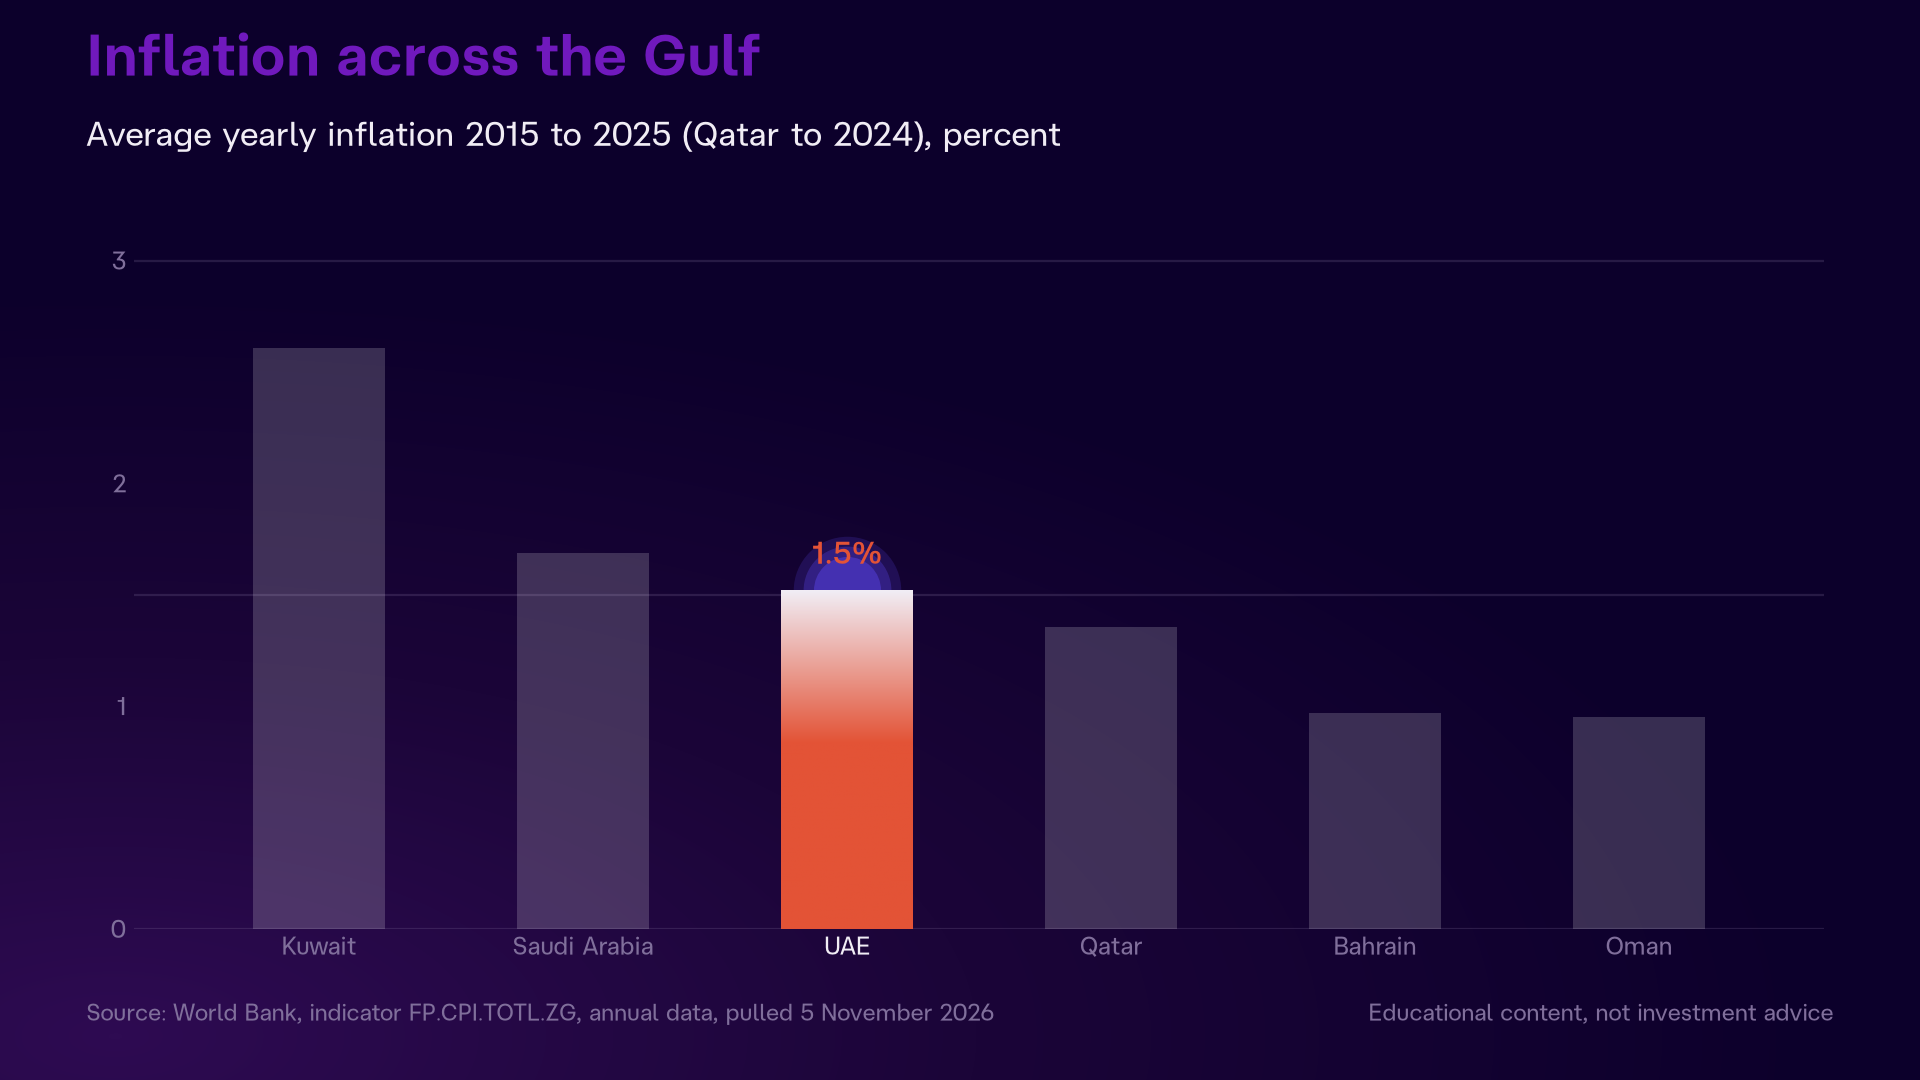
The same figures are available for the other Gulf states from the same source. Average annual inflation between 2015 and 2025 was 2.6% in Kuwait, 1.7% in Saudi Arabia, 1.5% in the UAE, 1.4% in Qatar (to 2024, since its 2025 figure is not yet published in the World Bank series), and under 1% in Bahrain and Oman. The UAE sits in the middle of the Gulf range.
The picture is the same over the last three years: between 2023 and 2025 UAE inflation ran 1.6%, then 1.7%, then 1.25%, below Kuwait in all three years and below Saudi Arabia in two of them, and above Bahrain and Oman.
The idle balance, year by year
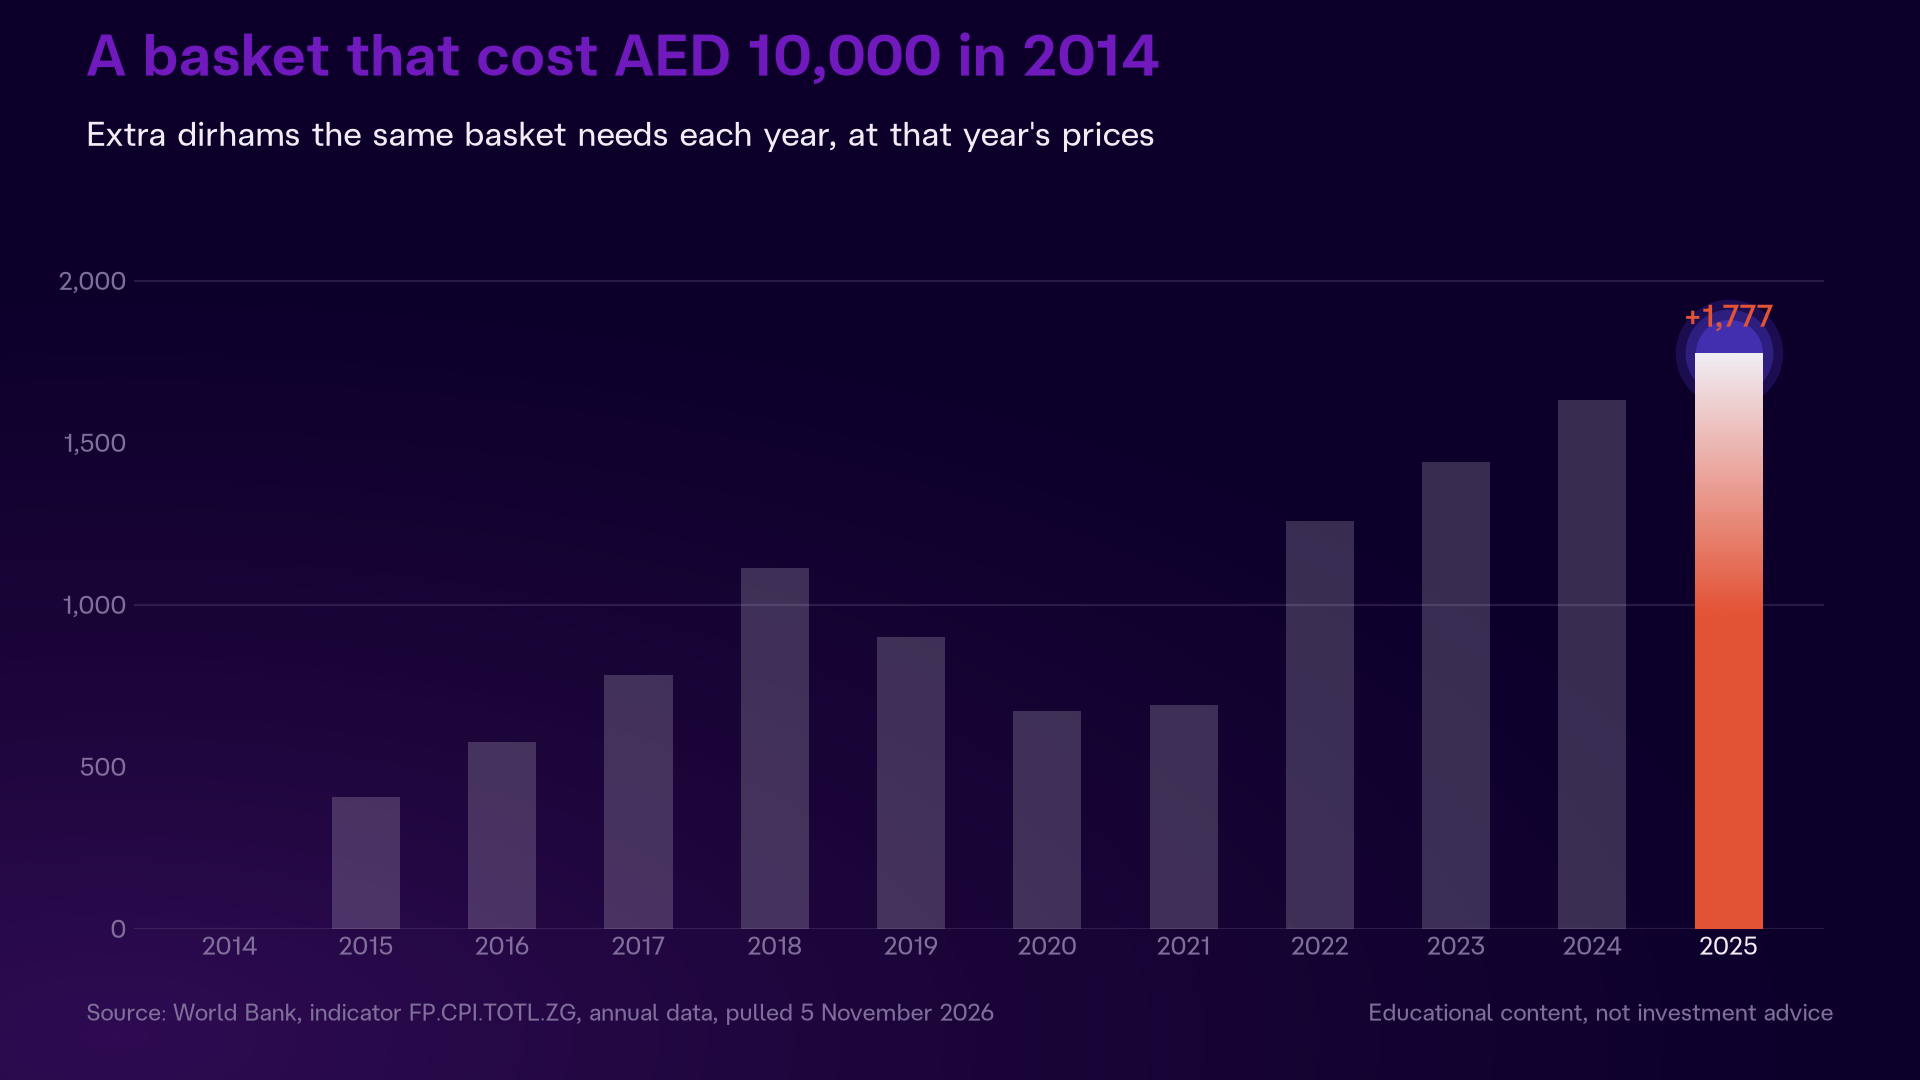
The next chart shows the same example another way: how many extra dirhams the basket that cost AED 10,000 in 2014 needs in each later year. The line is not straight. It climbs quickly in 2015 and 2018, dips in 2019 and 2020, jumps in 2022, then keeps rising in small steps.
The small steps are the deceptive part. Three consecutive years between 1.25% and 1.7% look harmless, yet together they lifted prices 4.6% between 2022 and 2025. Inflation compounds the same way a return does: each year builds on the one before it.
The reverse is also true. The two negative years, 2019 and 2020, gave back part of what had accumulated before them: at the end of 2020 the basket needed only AED 673 extra, down from AED 1,114 in 2018. Falling prices are rare, but they happened twice in this series.
Real return: the number that actually matters
Every return has two numbers. The nominal return is the percentage written down. The real return is what is left after subtracting inflation, and it is the one that measures whether purchasing power grew or shrank.
The arithmetic is approximate and simple: real return equals nominal return minus inflation. At the 2025 inflation rate of 1.25%:
- Money earning nothing: real return about minus 1.25%.
- Nominal return of 1%: real return about minus 0.25%.
- Nominal return of 3%: real return about plus 1.75%.
The exact calculation divides rather than subtracts, but at rates this small the difference is under a tenth of a percentage point. These are arithmetic examples on hypothetical rates, not the rates of any product, and inflation itself changes every year as the first chart shows. Past performance does not guarantee future results.
The rule that remains: a return below inflation means the money buys less over time even if the number grows. That is why people think about money they will not need soon in broad categories: saving, sukuk, and investing in assets. Each category has its own risk, liquidity and Sharia considerations, and weighing them depends on each person's situation, goals and time horizon, which is not the subject of this article. The Rethink Wealth Series in the Rethink app explains these basics in Arabic, from nominal against real to what risk means.
What this article leaves in hand: the annual inflation figure, the way to compound it year after year, and one question to put to any idle balance: how long will it sit? Other questions about money in the UAE are answered on our FAQ page.
Common mistakes
- Judging savings by the balance alone. The balance is fixed, but what it buys changes with prices every year.
- Assuming one low-inflation year cancels the ones before it. Increases accumulate: 2023 to 2025 alone lifted prices 4.6% combined even though each year looked small.
- Confusing "no volatility" with "no inflation". A cash balance is untouched by market swings, but it is exposed to rising prices every year, which is a risk of a different kind.